
What makes a band like Radiohead so endlessly fascinating? For some, it’s the restless experimentation—from the grunge guitars of Pablo Honey to the icy electronics of Kid A. For others, it’s the way they somehow stay recognizable while reinventing themselves every few years. But here’s a twist: what if you could measure all of this? What if a computer could tell you, with numbers and graphs, exactly how Radiohead’s sound has evolved over three decades?
That’s the question that drove Teodora Cvijović in her project Artist and Track Similarity Search with Content-Based Radio Feature (Cvijović, 2025). Instead of reading reviews or debating on forums, she turned to Music Information Retrieval (MIR)—a field that uses algorithms to break down songs into features like rhythm, timbre, harmony, and energy.
The idea was simple but ambitious: feed all 187 Radiohead songs into the system, strip them into data, and then ask the computer what connects them—and what sets them apart.
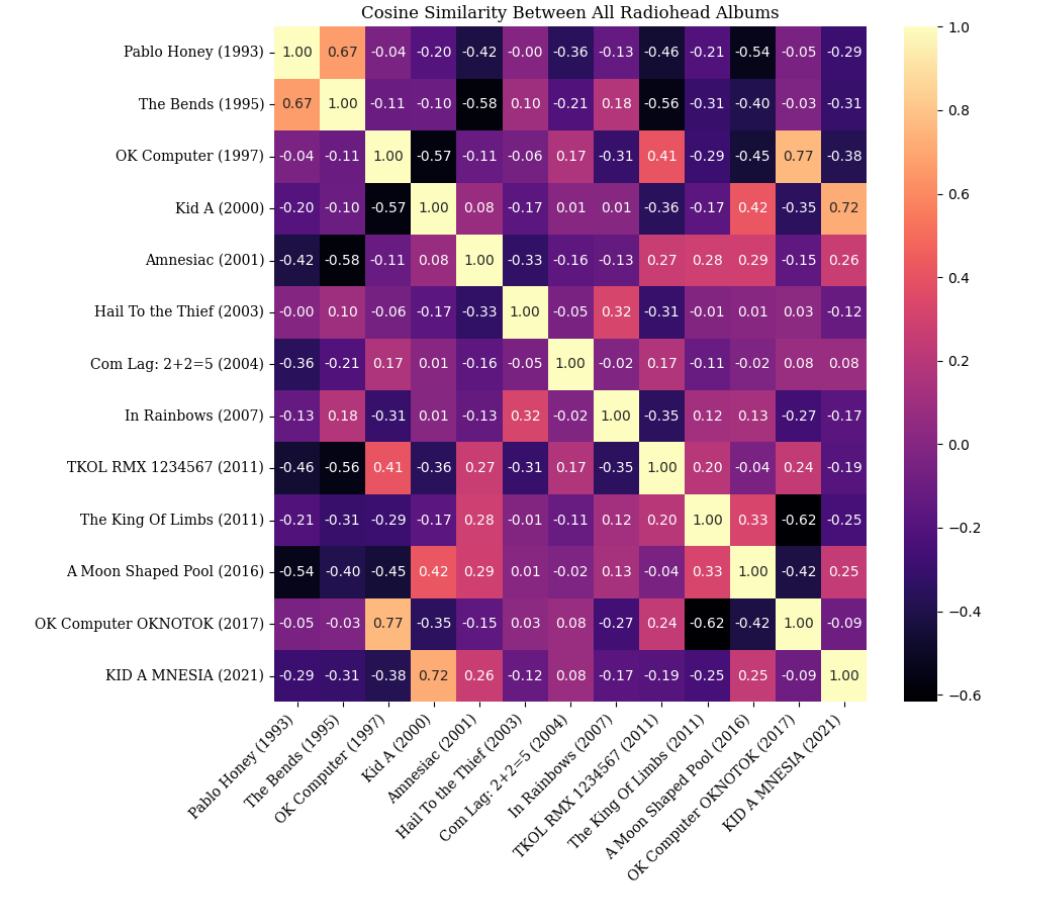
Figure 1: Cosine similarity heatmap between Radiohead albums
The results painted a story that fans already sense but rarely see visualized. OK Computer and its 2017 remake OKNOTOK appeared almost identical twins, echoing each other across twenty years. But then came surprises: Kid A and A Moon Shaped Pool, though separated by sixteen years, clustered closely together, as if two chapters of the same story. And the famous break between OK Computer and Kid A? The data marked it with precision—a sharp rupture that rewrote the band’s DNA.
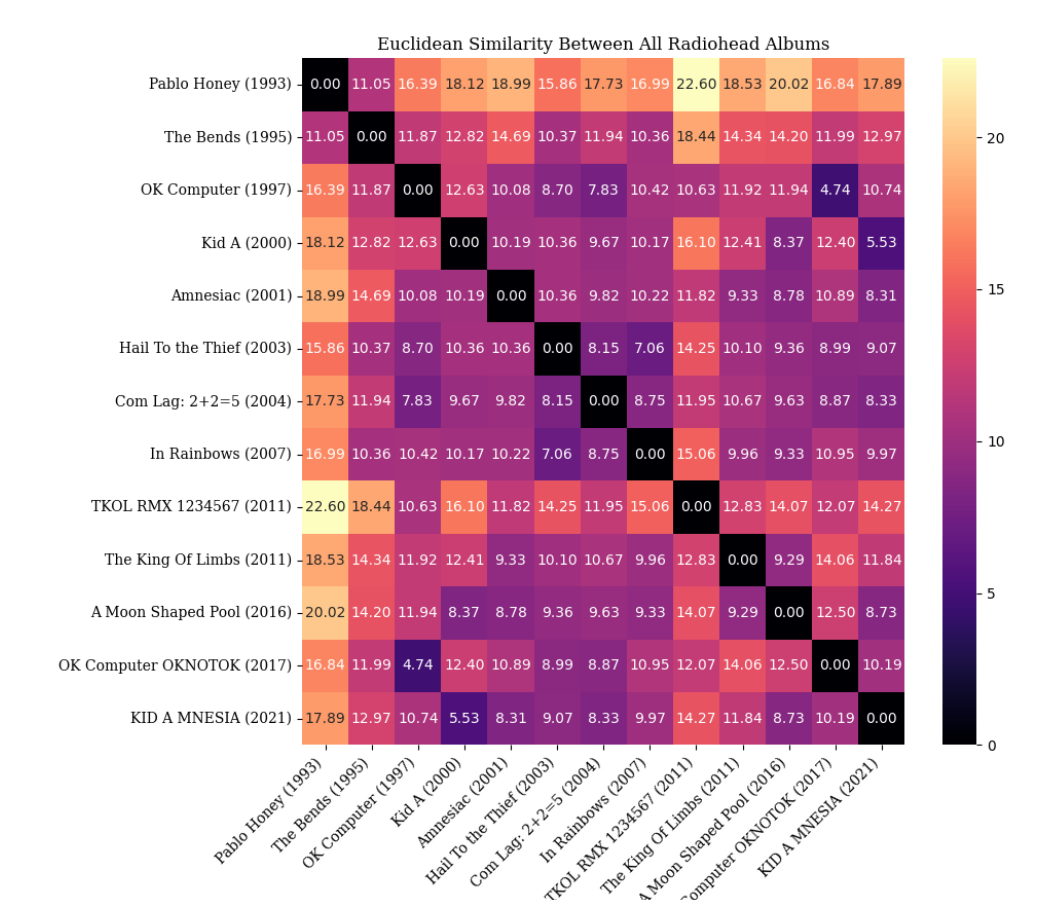 Figure 2: Euclidean similarity heatmap between Radiohead albums
But what’s a Radiohead analysis without outliers? Tracks like Fitter Happier—little more than a robotic voice reciting phrases—or the untitled sketches on KID A MNESIA didn’t just sound strange; the algorithms confirmed they were statistical rebels, sitting far away from the rest of the catalog. They’re the oddballs that even the data couldn’t assimilate.
To make these shifts easier to grasp, Teodora visualized the results with a technique called t-SNE, which maps complex data into two dimensions. Suddenly, Radiohead’s career fell into three distinct clusters: the raw alt-rock of the early years (Pablo Honey, The Bends), the bold experimental middle (Kid A, Amnesiac), and the atmospheric maturity of the later albums (In Rainbows, A Moon Shaped Pool).
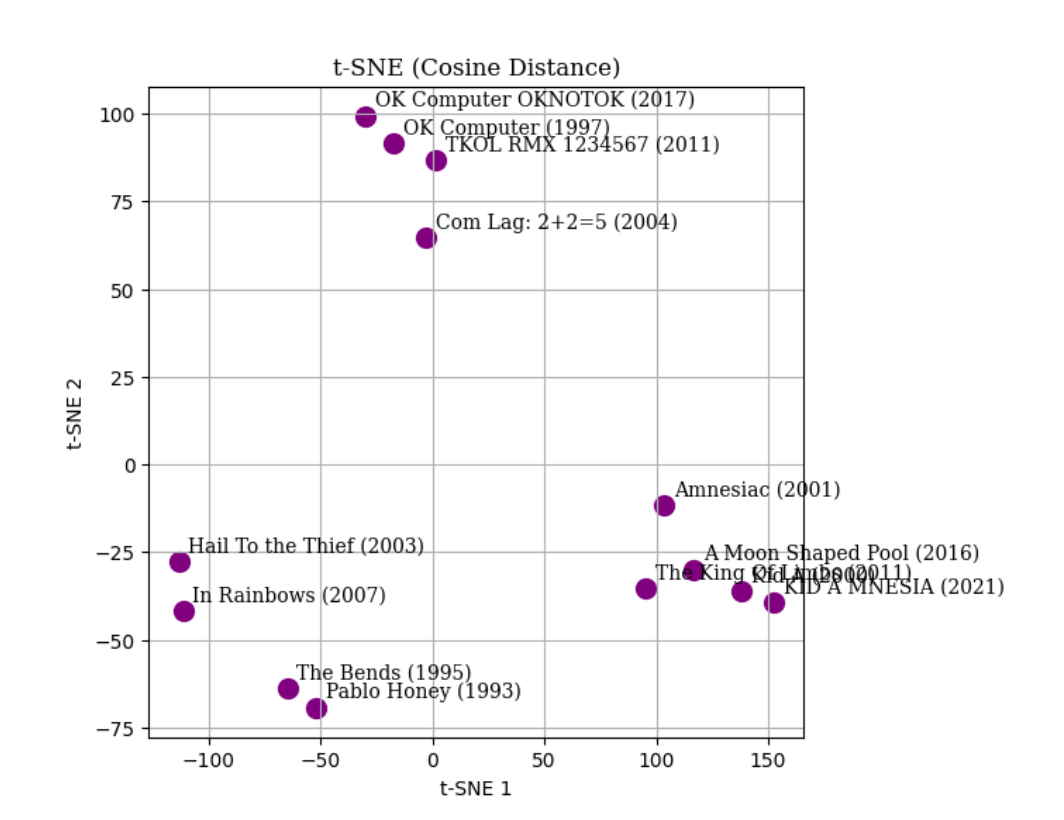 Figure 3: t-SNE plot using cosine similarity
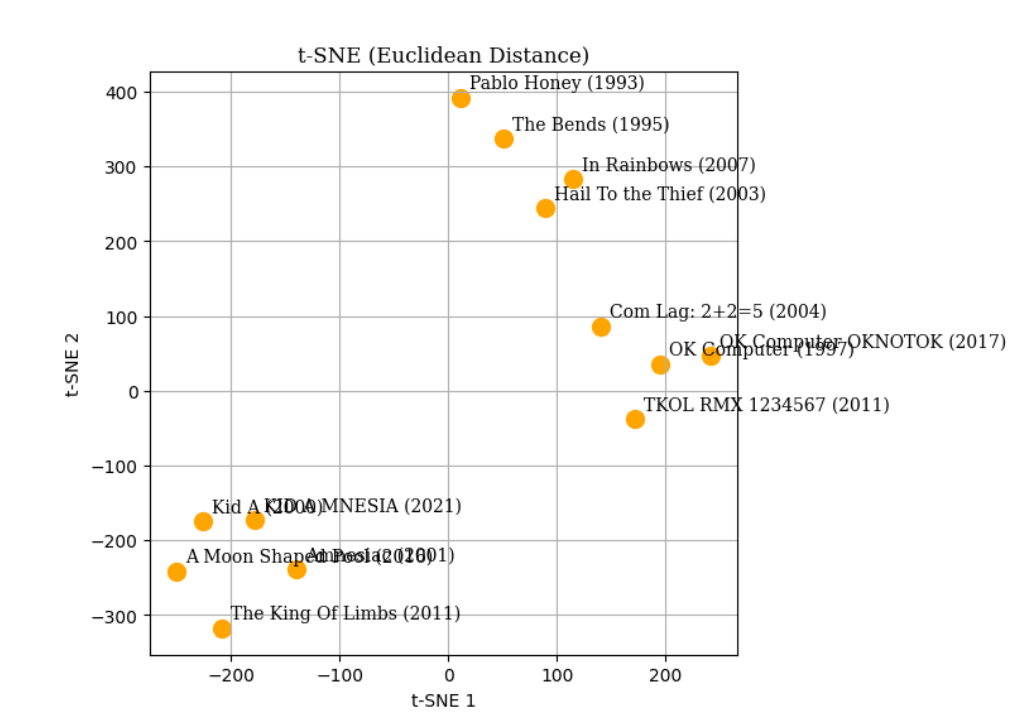 Figure 4: t-SNE plot using Euclidean similarity
What emerges is a portrait of a band in constant motion—sometimes circling back to its roots, sometimes leaping into new terrain. And the beauty of this approach is that it doesn’t replace listening; it adds another layer. You can still lose yourself in Thom Yorke’s voice or Jonny Greenwood’s guitars, but now you can also see their evolution in clusters, heatmaps, and outliers.
This project, developed under the supervision of Assoc. Prof. Athanasios Koutras at the University of Peloponnese, is part of PULSAR Radio’s ongoing effort to show that music is not just for the ears but also for the mind. By treating songs as data, Teodora turned Radiohead’s catalog into something like a map—one that tells a story of restlessness, reinvention, and return.
Reference: Teodora Cvijović, “Artist and Track Similarity Search with Content-Based Radio Feature,” Department of Electrical & Computer Engineering, University of Peloponnese, 2025.